 iSAYSO
Public Convictions vs Police Investigations
📉 NZ 2025: Public Convictions vs Police Investigations — A Per‑Capita Breakdown the Government Never Publishes
BY NIGEL GRAY INDEPENDENT INVESTIGATOR 4 SEPTEMBER 2026
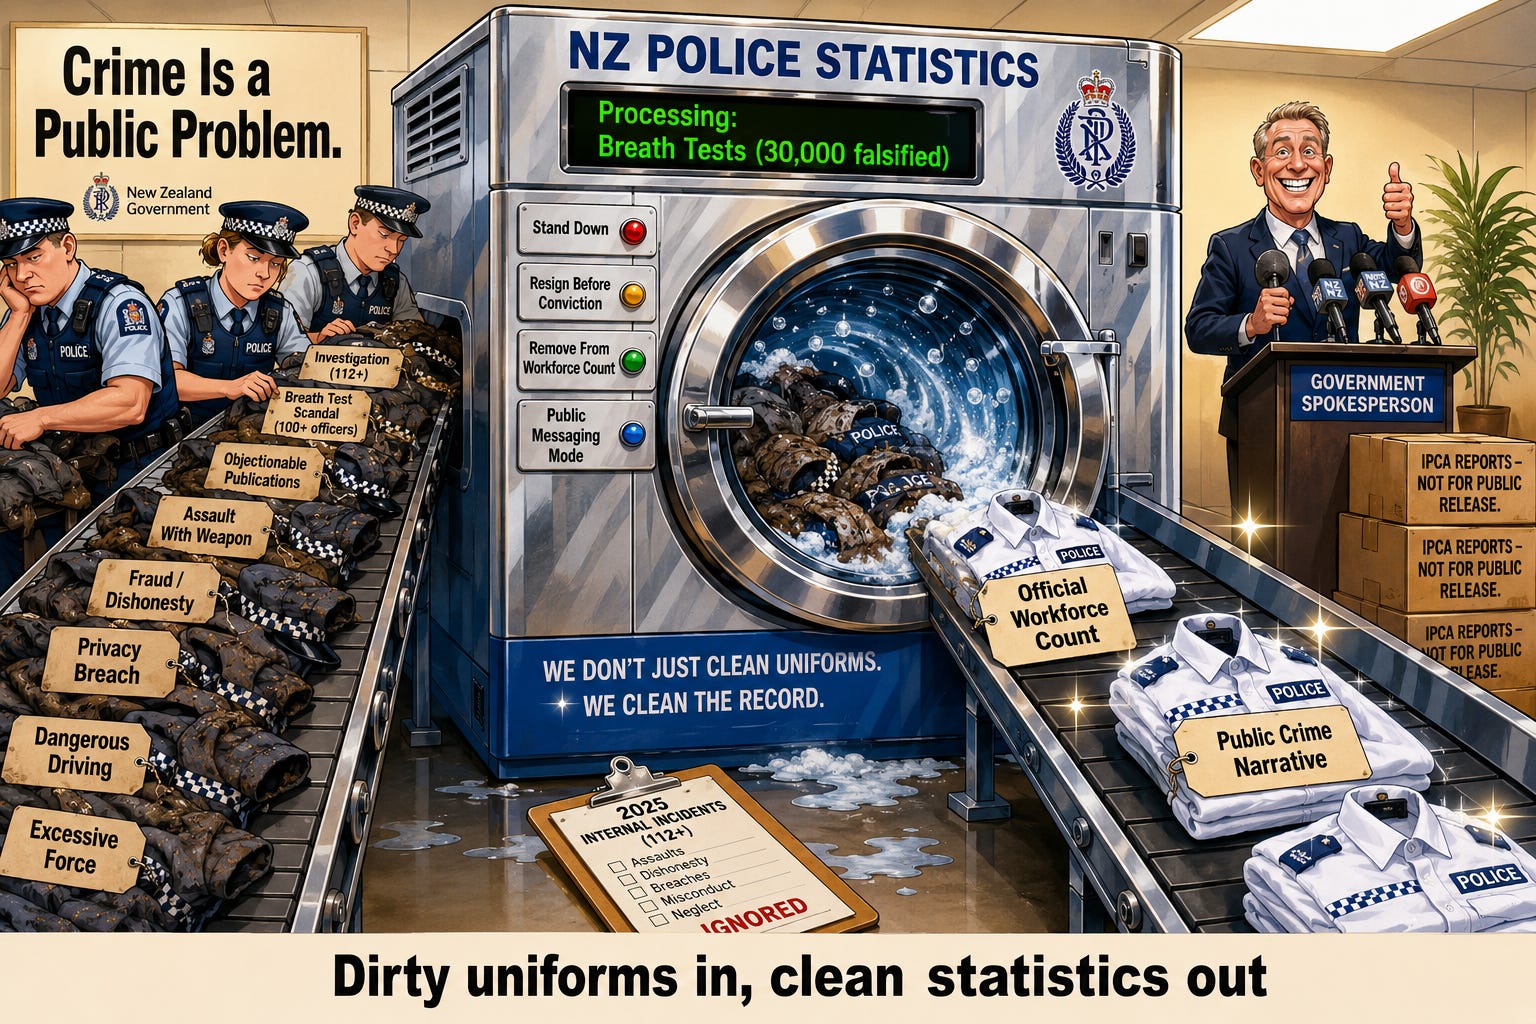
New Zealanders are told that crime is a “public problem.”
But the numbers from 2025 tell a very different story — one the official agencies never place side‑by‑side.
This is the first forensic comparison of public convictions versus police investigations, adjusted per capita using official population and workforce numbers.
And the result is simple:
In 2025, NZ Police were investigated at a higher per‑capita rate than the public were convicted.
Let’s walk through the numbers.
1. Public Convictions (2025)
Stats NZ and Ministry of Justice data show:
32,797 adult convictions
Population: ~5,250,000
Per‑capita conviction rate:
32,7975,250,000≈0.00625⇒≈ 6.2 convictions per 1,000 people
This is the number politicians quote when they talk about “public crime.”
But they never compare it to their own institution.
2. Police Investigations (2025)
This is where the picture flips.
The breath‑test falsification scandal
RNZ reporting confirmed:
100+ police officers investigated
30,000 falsified breath tests
Multi‑district misconduct
Dishonesty, coercion, record manipulation
This scandal alone exceeds the entire annual number of police officers charged or convicted.
Other 2025 investigations (criminal + misconduct)
Media‑verified cases include:
Objectionable publication offences (Deputy Commissioner)
Assault with a weapon
Dangerous driving causing injury
Fraud/dishonesty
Privacy breaches
Sexual misconduct
Excessive force
Falsified reports
Minimum additional officers: 12
Total minimum police investigated (2025):
100+12=112 officers
Police workforce:
~15,600 staff
Per‑capita investigation rate:
11215,600≈0.00718⇒≈ 7.2 investigations per 1,000 staff
📊 Side‑by‑Side Comparison (2025)
GroupTotal (2025)Population BaseRate per 1,000NZ Public — Convicted32,7975,250,000 = 6.2
NZ Police — Investigated≥11215,600 = 7.2
Police were investigated at a higher per‑capita rate than the public were convicted.
This is not a political statement.
It is arithmetic.
3. Why This Matters
A. Investigations are the real indicator of misconduct volume
Convictions are the endpoint.
Investigations show the scale.
B. Police numbers are “sanitised”
When an officer is investigated, they are often:
stood down
suspended
quietly removed
allowed to resign
This means the police workforce denominator shrinks, artificially lowering per‑officer rates.
The public denominator never shrinks.
C. The public is measured by convictions; police are measured by silence
There is:
no annual police investigation report
no annual police misconduct count
no annual police criminal charge tally
no annual police conviction dataset
The public is measured.
The police are protected.
4. The Contradiction at the Heart of NZ’s Crime Narrative
New Zealand’s political messaging frames crime as a public failing.
But the numbers show:
Public conviction rate: 6.2 per 1,000
Police investigation rate: 7.2 per 1,000
The institution responsible for enforcing the law is investigated more often per capita than the population it polices.
This is not a fringe claim.
It is a structural contradiction.
5. The Question New Zealand Should Be Asking
If the public is judged by convictions,
and the police are judged by nothing,
what does that say about accountability?
And more importantly:
Why is the only institution with guns, immunity, and coercive power the one with the least transparent misconduct reporting?
6. Closing
This comparison is not available in any official publication.
It is not produced by NZ Police, IPCA, Stats NZ, or the Ministry of Justice.
It exists only when someone puts the numbers together.
Now it’s public.