iSAYSO
What is driving the intensification of flooding in New Zealand?
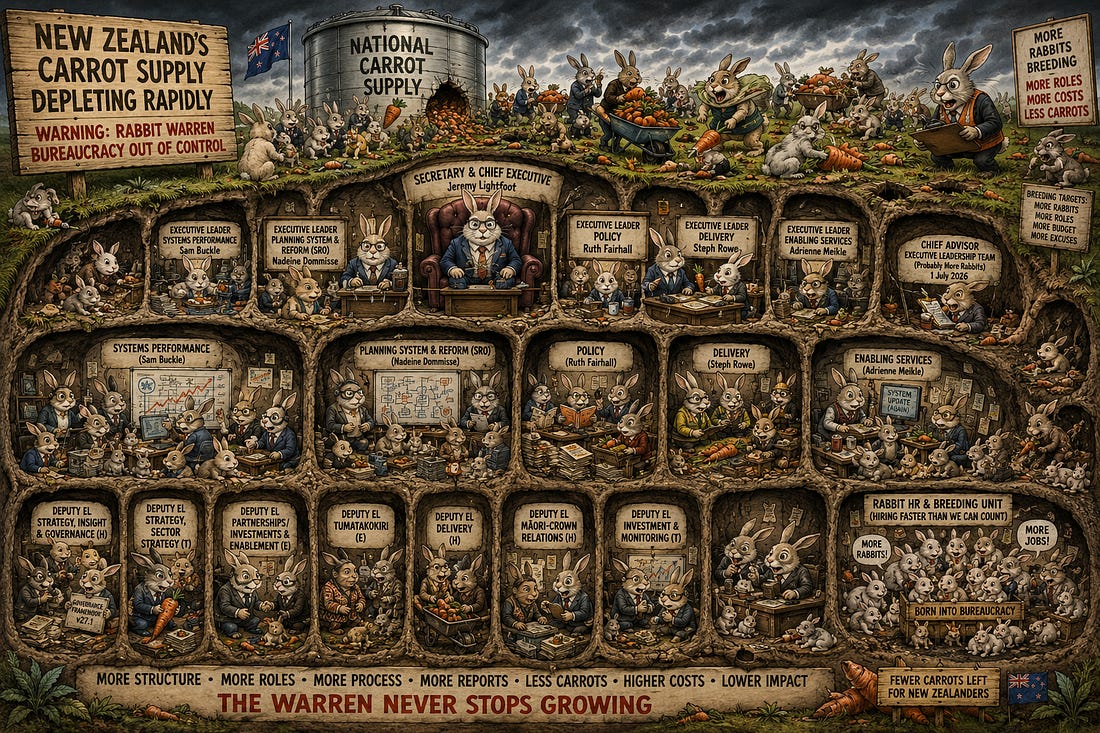
The Great MCERT Rabbit FarmThe New “Ministry for Cities, Environment, Regions and Transport”A Ministry With Hundreds of Holes, Thousands of Rabbits, and No Carrots to Show for ItMinistry for Cities, Environment, Regions and Transport BY NIGEL GRAY INDEPENDENT INVESTIGATOR 28 AUGUST 2026
Preface — How a Flood Investigation Turned Into a Rabbit HuntI began this investigation with a simple question: I wasn’t looking for politics. So I did what any investigator does — I followed the evidence. I isolated variables. And the conclusion was unavoidable: Shipping emissions are a primary driver of flood‑intensifying cloud formation in New Zealand. That was the science. Then came the shock. Because when I turned to government agencies to see whether they held information relevant to this — they did. But what I did not expect to discover was something else entirely. Not a missing dataset. I discovered a rabbit infestation. A sprawling, multi‑layered, multi‑managerial warren of roles, titles, chiefs, leaders, deputy leaders, general managers, programme managers, team leaders, heads, directors, and transformation officers — all burrowing in different directions, all very busy, all very important, and none of them producing the one thing New Zealand actually needs: measurement. What began as an environmental investigation ended as a structural one. Because behind every unanswered question, every contradictory OIA response, every missing dataset, every “we do not monitor this,” every “we hold no information,” every “no evidence exists,” was not a scientific problem. It was a bureaucratic ecosystem. A Ministry of Rabbits. And once you see it, you cannot unsee it. There’s a moment in every investigation where the metaphor becomes clearer than the facts themselves. Because what they sent wasn’t a chart. A sprawling, multi‑layered, multi‑tunneled, multi‑managerial warren of roles, titles, chiefs, leaders, deputy leaders, general managers, programme managers, team leaders, heads, directors, and transformation officers — all burrowing in different directions, all very busy, all very important, and none of them producing anything measurable. So let’s call it what it is. A Ministry of Rabbits. 🐇 How Many Rabbits?The organisational chart shows 520–600 management‑grade roles. Not analysts. Just rabbits with titles. And that’s only the visible ones. 🕳️ How Many Holes?Each rabbit has a hole. Some have several. The chart shows: 6 Executive Leaders 20+ Deputy Executive Leaders 40+ General Managers 100+ Directors 200+ Managers 100+ Team Leaders 50+ Chiefs, Heads, Leads, Programme Managers Every one of these is a hole. And every title has a salary.
💰 How Much Are We Feeding Them?Even at the lowest public‑sector salary bands: Team Leaders: $95k–$130k Managers: $120k–$160k General Managers: $200k–$280k Executive Leaders: $300k–$380k Chief Executive: $540k–$620k The visible rabbit‑population alone costs: ≈ 68M–72M per year Once you include the full warren: ≈ 180M–260M per year That’s a quarter of a billion dollars. A quarter of a billion dollars… 🥕 How Many Carrots Do They Produce?This is the part that matters. Because a rabbit farm is fine — if it produces carrots. But MCERT does not produce carrots. It does not produce: shipping emissions data atmospheric hazard monitoring aerosol surveillance CCN measurement environmental risk detection scientific outputs operational outputs measurable public value It produces: templates inboxes workflows intranet pages SME lists coordination meetings “holding the pen” “logging into workflow tools” “updating templates” “discussing inbox access” This is administrative metabolism, not environmental protection. It is a Ministry designed to move paper, not measure reality. 🔥 The OIA That Cuts Straight to the Heart of the Rabbit FarmThis is the OIA that exposes the warren: Total staff count Total salary cost Total measurable output If they answer honestly, the public will see the truth. Either way, the rabbit farm is exposed. 🎯 Why This MattersBecause New Zealanders believe they have a Ministry that protects the environment. What they actually have is: a Ministry that protects its inboxes a Ministry that protects its templates a Ministry that protects its workflows a Ministry that protects its hierarchy a Ministry that protects its rabbits And the environment? It’s not even on the chart.
Nigel’s Substack is a reader-supported publication. To receive new posts and support my work, consider becoming a free or paid subscriber. © 2026 Nigel Gray
|